
Amongst the hustle-and-bustle of business life, it can sometimes be difficult to tell how your organisation is actually performing and whether it’s in the best possible financial position.
Whilst some more involved and technical aspects might require guidance from an external adviser, there are some relatively simple calculations you can do yourself to get a quick diagnostic check on your business. You should be able to work out the metrics outlined in this article using the data from your profit and loss statement or balance sheet.
1. Gross profit percentage
Gross profit is calculated by subtracting the cost of goods sold (COGS) from revenue. COGS are the direct costs involved with producing or purchasing (such as labour, or materials) the products/services a business sells. This ignores fixed costs and overheads.
Comparing gross profit figures over time can indicate if your products/services are becoming more or less profitable, but you may want more detail to assess business performance…

Gross profit margin is the percentage of a business’s revenue retained after direct costs have been subtracted, showing how production/delivery costs relate to revenue. This demonstrates how much gross profit is made for every pound of sales revenue received. When analysed alongside other business’s data, your gross profit margin can be used to measure efficiency.
If your gross profit percentage seems unacceptable, you might aim to reduce labour costs, find cheaper suppliers, or increase prices.
2. Net profit percentage
Net profit is calculated by deducting all costs (not just COGS) away from gross profit.

The net profit margin is the proportion of sales revenue left once all costs have been paid. This tells a business how much net profit is made for every pound of sales revenue received.
Net profit tends to be lower than gross profit, as it accounts for more costs (including fixed costs and overheads). Consequently, the same follows for the net profit margin in comparison to gross profit margin.
Looking at both your net and gross profit margin for the same time period, you can identify the significance of your fixed costs and overheads, and whether these can be adjusted to benefit your business’s profitability. Are you generating enough revenue to cover all your costs?
3. Working capital
Working capital is the money a business needs to operate day-to-day. This represents the difference between current assets (cash, accounts receivable, inventory, etc.) and current liabilities (accounts payable, debts, etc.) In this context, current assets and current liabilities apply to what a business already has and what it is expected to spend over the next 12 months.

Generally, a business with positive working capital is in a good position to invest and expand. A negative working capital may indicate that an organisation could face difficulties in paying its liabilities, impact growth, and in the most extreme circumstances go bankrupt.
However, a negative working capital isn’t always bad, depending on the specific business and how it manages its cashflow. For example, new projects often involve a significant outlay, which might result in negative working capital short-term. If this situation occurs long-term, this is more concerning.
It’s worth remembering that working capital is always evolving, where current assets and liabilities change constantly. Calculating your working capital will only give you a snapshot of your operations, so regular review is required for better insight.
To boost your working capital, you might try to extend the time your creditors require payment, reduce the time your debtors need to pay you, or manage your inventory more precisely to demand.
4. Current ratio
Similar to working capital, the current ratio demonstrates whether a business can pay current liabilities within 12 months.
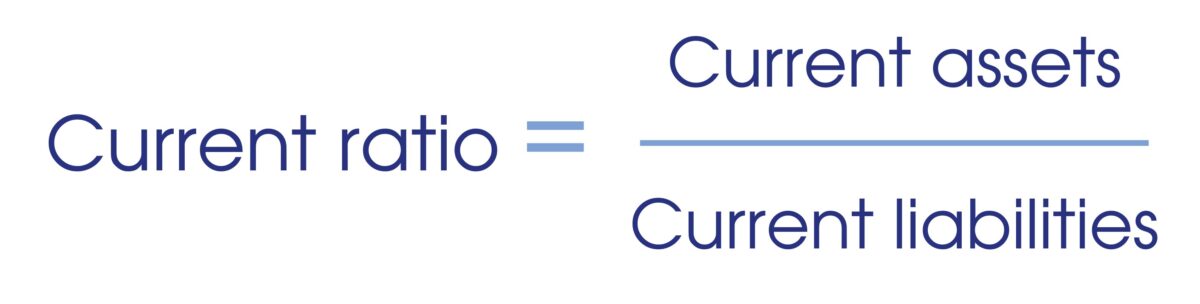
A current ratio higher than 1.00 suggests that a business has the financial resources to remain solvent short-term. Whilst a higher ratio is generally preferable, more than 3.00 could indicate that a business’s current assets are not being using used to best effect and there is an imbalance in their cashflow.
As with all the other metrics covered in this article, calculating your current ratio regularly will give you a clearer, more comprehensive picture of your organisation’s finances.
5. Quick ratio
The quick ratio measures a business’s ability to immediately meet its short-term liabilities, using its most liquid assets and discounting inventory.

Inventory is traditionally more difficult to turn into cash than current assets. This metric accounts for the fact that inventory may reduce in value, because it has a limited shelf-life or demand falls. It deters organisations from relying on their stock.
A business that has a quick ratio of below 1.00 might not be able to meet its current liabilities short-term. Alternatively, an organisation that has a quick ratio of more than 1.00 could (if required) instantly get rid of its current liabilities.
Although this metric is useful, it doesn’t give any indication of future cash flow activity.
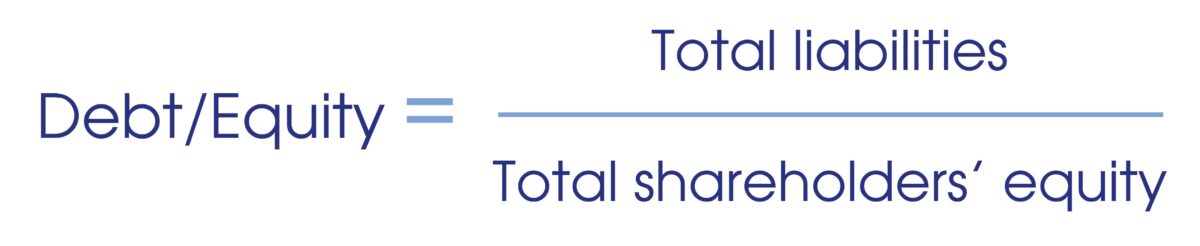
6. Debt to equity ratio
A business’s debt to equity (D/E) ratio regards its leverage or gearing, and is commonly seen as a measure of stability. It’s an important metric, because it gauges to what degree an organisation finances its operations with debt, rather than its own resources. This would be vital should they experience issues with trading or other operational problems.
Shareholder equity is a business’s net worth, or its total assets minus its total liabilities. It’s equal to the financial amount that would be returned to the shareholders if the organisation was liquidated and its debts paid off.
Knowing what types of liabilities are included in your D/E ratio calculation is crucial to understanding its result. Short-term liabilities are typically of less of concern, as they should be settled in 12 months, unless there are many liabilities of this kind. Long-term liabilities represent more substantial commitments and are therefore more contributory to the overall financial health of your business.
Although debt can be perceived negatively, a healthy level of debt can allow a business to grow. However, what’s ‘healthy’ will vary between organisations, dependent on their needs and industry. Don’t be tempted to over-exceed your means. Borrowing that seemed prudent at first can prove unprofitable later.
A high D/E ratio is often associated with high investment risk, where a business relies primarily on debt financing. A D/E ratio below 1.00 would generally be seen as relatively safe; 2.00 or more might be seen as risky. A particularly low D/E ratio can also be a problem, indicating that an organisation isn’t taking advantage of debt financing and its tax advantages.
Need some guidance?
If you would like to sit down and talk to a specialist, who can assist you in interpreting your data better, the Burton Sweet team would be happy to help. We can provide a more insightful perspective on your business’s numbers and recommend practical actions to improve them.